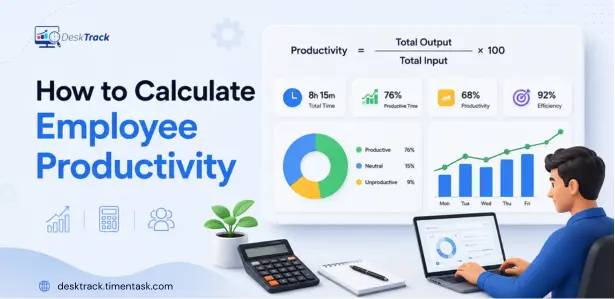
Employee productivity is more than the number of hours someone spends at work. It is about understanding how effectively time, effort, and other resources are converted into meaningful output.
For managers and business leaders, measuring employee productivity can help identify workflow bottlenecks, understand workload distribution, improve processes, and make better workforce decisions.
But how do you actually calculate it?
The basic approach is simple:
Employee Productivity = Output ÷ Input
However, the right productivity calculation depends on the employee’s role, the type of work being performed, and how output is defined.
In this guide, you’ll learn how to calculate productivity, which employee productivity metrics to track, different productivity formulas you can use, practical examples, and how automated tools can simplify employee productivity measurement.
How Do You Calculate Employee Productivity?
The basic employee productivity formula is:
Employee Productivity = Total Output ÷ Total Input
If you’re measuring output against time, the formula becomes:
Productivity = Total Output ÷ Total Hours Worked
Example
Suppose a customer support representative resolves 160 tickets during 40 hours of work.
Productivity = 160 ÷ 40 = 4 tickets per hour
This means the employee completed an average of 4 tickets per hour.
The important part is choosing an output measure that makes sense for the role. Productivity for a salesperson may be measured through revenue or deals closed, while a developer may be measured through completed features, resolved bugs, or project milestones.
What is Employee Productivity?
Employee productivity measures the amount and quality of work produced compared with the resources used to produce it.
The resources, or inputs, can include:
- Working hours
- Labor costs
- Equipment
- Materials
- Technology
- Other operational resources
Output can be measured in different ways depending on the job.
For example:
- A sales representative may generate revenue or close deals.
- A customer support agent may resolve tickets.
- A developer may complete features or resolve bugs.
- A content team may publish articles or generate qualified leads.
- An operations employee may process orders or complete workflows.
This is why there isn’t one universal productivity score that works equally well for every employee.
Effective employee productivity measurement starts by defining what meaningful output looks like for each role.
Why is Measuring Employee Productivity Important?
Measuring employee productivity gives managers a clearer picture of how work gets done.
Instead of relying only on assumptions, managers can use productivity data to identify patterns such as:
- Where employees spend most of their working hours
- Which processes are creating delays
- Where workloads are uneven
- Which tasks consume excessive time
- Whether teams are meeting expected targets
- Where additional resources or training may be needed
- Which workflows are creating unnecessary bottlenecks
Productivity data can also help organizations make better decisions about staffing, project planning, workload allocation, and process improvement.
However, productivity should not be treated as simply “more work is better.” Quality, complexity, customer outcomes, and business value should also be considered.
No Credit Card Required
Are Your Employees Busy or Actually Productive?
Measure output, working time, quality, and productivity trends to understand where your team’s time really goes..
How to Calculate Employee Productivity Step by Step?
The process becomes easier when you break the calculation into a few simple steps.
Step 1: Define the Output
First, determine what the employee produces during a specific period.
Your output could be:
- Units produced
- Tasks completed
- Tickets resolved
- Deals closed
- Revenue generated
- Projects completed
- Features delivered
- Reports processed
Choose an output that is measurable and relevant to the employee’s responsibilities.
For example, counting the number of emails sent may not accurately represent a sales employee’s productivity if the real business outcome is qualified opportunities or closed revenue.
Step 2: Determine the Input
Next, identify the resources used to produce that output.
For many knowledge-work roles, the most practical input is time.
For example:
Total hours worked = 40 hours
You can also use labor cost, number of employees, or other resources when a broader productivity calculation is required.
Step 3: Apply the Productivity Formula
Use:
Productivity = Output ÷ Input
If time is the input:
Productivity = Output ÷ Hours Worked
Step 4: Compare the Results
A single productivity calculation doesn’t tell the whole story.
Compare productivity:
- Week over week
- Month over month
- Across similar roles
- Across teams
- Against established targets
- Before and after process changes
This helps you identify trends instead of making decisions based on one isolated number.
Employee Productivity Formula: The Most Useful Formulas
Different situations require different approaches. Here are several useful formulas for calculating productivity.
1. Basic Productivity Formula
The simplest productivity formula is:
Productivity = Output ÷ Input
When hours are the input:
Productivity = Output ÷ Hours Worked
Example
An employee completes 240 tasks in 60 hours.
240 ÷ 60 = 4 tasks per hour
The employee’s productivity is therefore 4 tasks per hour.
This formula works particularly well when the output is relatively consistent and easy to quantify.
2. Productivity Rate Formula
You can also express productivity as a rate when comparing output against a defined input.
Productivity Rate = Total Output ÷ Total Input
For example, a team completes 1,200 customer requests in 300 working hours.
1,200 ÷ 300 = 4 requests per hour
This gives managers a consistent metric for comparing performance across similar periods.
Important: Avoid assuming that every employee should have a productivity rate of 100%. Productivity is not universally measured against a 100% baseline. The appropriate benchmark depends on the role, workload, output definition, and business process.
3. Productivity Per Employee Formula
If you want to understand average output across a workforce, use:
Productivity Per Employee = Total Output ÷ Number of Employees
Example
A department completes 2,000 service requests in a month with 20 employees.
2,000 ÷ 20 = 100 requests per employee
This can help managers understand average team output and identify changes over time.
4. Revenue Per Employee Formula
For organizations where financial output is meaningful, revenue per employee can provide another perspective.
Revenue Per Employee = Total Revenue ÷ Number of Employees
Example
A company generates $5 million in annual revenue with 100 employees.
$5,000,000 ÷ 100 = $50,000 revenue per employee
This metric is useful at an organizational level, but it should not be treated as an individual employee performance score because many factors beyond individual effort influence revenue.
5. Productivity Index Formula
A productivity index helps compare current productivity with a previous baseline.
Productivity Index = (Current Productivity ÷ Base Productivity) × 100
Example
Suppose a team’s productivity was 8 completed tasks per hour during the baseline period and increased to 10 tasks per hour.
(10 ÷ 8) × 100 = 125%
A result of 125% means productivity is 25% higher than the baseline.
This approach is useful when measuring the impact of process improvements, training, new tools, or workflow changes.
Employee Productivity Metrics to Track
A strong productivity measurement strategy should use multiple employee productivity metrics rather than relying on one number.
Here are some useful metrics:
Output Per Hour
Measures how much work is completed for each hour worked.
Formula:
Output Per Hour = Total Output ÷ Hours Worked
Task Completion Rate
Shows how effectively assigned tasks are completed within a specific period.
Formula:
Task Completion Rate = Completed Tasks ÷ Assigned Tasks × 100
Revenue Per Employee
Shows average revenue generated per employee.
Formula:
Revenue Per Employee = Total Revenue ÷ Number of Employees
Utilization Rate
Measures how much available working time is spent on productive or billable activities.
Quality Rate
Productivity should not be evaluated only by quantity. Error rates, customer satisfaction, rework, and quality scores can provide important context.
Productive vs. Idle Time
Time data can help identify periods of high activity, extended inactivity, workflow interruptions, or workload issues.
These metrics work best together. For example, an employee completing more tasks is not necessarily more productive if the increase in volume also creates a significant drop in quality.
Employee Productivity Calculation Examples
The best productivity metric depends on the type of work being measured.
Example 1: Customer Support
A support agent resolves 180 tickets in 45 hours.
Productivity = 180 ÷ 45
= 4 tickets per hour
However, managers should also consider customer satisfaction, resolution quality, and ticket complexity.
Example 2: Sales
A sales representative generates $80,000 in new business during a month and works 160 hours.
You could calculate:
Revenue Per Hour = $80,000 ÷ 160
= $500 per hour
Revenue alone should not be used to judge individual productivity because deal size, territory, lead quality, and sales cycles can vary.
Example 3: Software Development
A development team completes 30 meaningful project tasks during 300 hours.
Productivity = 30 ÷ 300
= 0.1 tasks per hour
For development teams, however, task counts can be misleading. Complexity, code quality, bugs, review time, and project milestones should also be considered.
Example 4: Operations
An operations employee processes 600 orders during 50 hours.
Productivity = 600 ÷ 50
= 12 orders per hour
This provides a simple baseline that can be compared over time.
How to Measure Productivity at Work Without Micromanaging
One of the biggest challenges with how to measure productivity at work is finding the balance between visibility and employee autonomy.
Productivity measurement should help managers understand workflows not constantly watch employees.
A better approach is to focus on:
1. Measure Outcomes
Start with meaningful results rather than simply counting hours online.
2. Track Time Patterns
Look at how working time is distributed across tasks, projects, applications, and activities.
3. Identify Bottlenecks
A productivity problem may actually be caused by unclear processes, excessive meetings, slow approvals, or dependencies between teams.
4. Compare Trends
Look for changes over time instead of judging an employee from one day’s data.
5. Combine Quantity With Quality
High output with poor quality isn’t sustainable productivity.
6. Use Data for Coaching
Productivity insights should help managers identify where employees need support, better resources, or workflow improvements.
This approach makes it possible to measure employee productivity without turning productivity tracking into unnecessary micromanagement.
What Should an Employee Productivity Report Include?
An employee productivity report should turn raw activity and time data into information managers can actually use.
A useful productivity report for employees may include:
- Total hours worked
- Productive hours
- Idle time
- Active time
- Tasks completed
- Project time
- Application usage
- Website activity
- Productivity trends
- Attendance data
- Team comparisons
- Daily or weekly performance trends
A staff productivity report can help managers identify changes in workload, productivity patterns, and potential workflow issues.
The goal isn’t to create more reports. The goal is to create reports that answer useful questions:
Where is time being spent?
What work is getting completed?
Where are bottlenecks occurring?
Is productivity improving or declining?
Does the team have the capacity for more work?
Manual vs. Automated Employee Productivity Measurement
Manual productivity calculation can be a good starting point for a small team, but it becomes difficult as the workforce grows.
| Manual Measurement | Automated Measurement |
| Spreadsheet-based tracking | Automatic data collection |
| Employees enter data manually | Activity and time data are captured automatically |
| Reports take time to prepare | Reports can be generated automatically |
| Higher risk of missing data | More consistent data |
| Limited visibility | Detailed productivity trends |
| Difficult to monitor frequently | Easier daily or weekly analysis |
Automated tools can combine time tracking, activity data, application usage, idle time, and reporting into a single workflow.
This allows managers to spend less time collecting data and more time understanding what the data means.
How DeskTrack Helps Measure Employee Productivity
Once you understand the right employee productivity formula, the next challenge is collecting reliable data.
DeskTrack helps automate employee productivity measurement by providing visibility into work time, application usage, activity, idle periods, and productivity trends.
With DeskTrack, managers can use:
- Employee time tracking
- Activity tracking
- Application and website usage
- Idle time tracking
- Productivity monitoring
- Screenshot monitoring
- Automated reporting
- Team and employee productivity insights
You can learn more about [employee monitoring software] and how it can provide visibility into employee work activity.
For organizations that want a dedicated approach to productivity analysis, [productivity monitoring software] can help turn work activity data into actionable productivity insights.
The benefit is that managers don’t have to depend entirely on manually maintained spreadsheets to understand how working time is being used.
Stop Guessing, Start Measuring Productivity
Get clear insights into how your team spends time, where bottlenecks occur, and where productivity can improve..
Common Mistakes When Measuring Employee Productivity
Even a good formula can produce misleading results if the measurement approach is wrong.
1. Measuring Hours Instead of Outcomes
Working longer doesn’t automatically mean producing more value.
2. Using the Same Formula for Every Role
A developer, salesperson, customer support agent, and designer produce different types of output.
3. Ignoring Quality
A higher number of completed tasks isn’t useful if the work requires extensive rework.
4. Treating Idle Time as Automatically Unproductive
Idle time can represent breaks, meetings away from the computer, thinking time, or workflow dependencies.
Context matters.
5. Comparing Employees Without Considering Workload
Two employees may have different productivity numbers because they are working on projects with different complexity levels.
6. Measuring Productivity Only Once
A single report provides limited insight. Productivity trends are much more useful for decision-making.
7. Relying Only on Self-Reported Data
Manual records can contain missing, estimated, or inconsistent information. Automated data collection can provide a more consistent foundation for analysis.
How to Improve Employee Productivity After Measuring It
Calculating productivity is only the first step.
Once you have the data, use it to identify opportunities for improvement.
Reduce Workflow Bottlenecks
If employees spend significant time waiting for approvals, information, or other teams, address the process rather than blaming individual performance.
Reduce Unnecessary Meetings
Excessive meetings can reduce focused work time and interrupt important tasks.
Balance Workloads
Productivity data can reveal employees who are consistently overloaded while others have additional capacity.
Improve Processes
If the same task repeatedly consumes excessive time, look for automation or process improvements.
Provide Targeted Support
Use productivity trends to determine where employees may need training, clearer expectations, or better resources.
Set Role-Specific Goals
Productivity targets should reflect the employee’s actual responsibilities and the complexity of their work.
Conclusion
There is no single number that defines employee productivity.
The right approach starts with a simple productivity formula:
Productivity = Output ÷ Input
From there, organizations can use role-specific metrics, productivity trends, quality measures, and workload data to build a more complete picture of performance.
The most effective employee productivity measurement strategy doesn’t focus on making employees work longer. It focuses on understanding how work gets done, identifying bottlenecks, improving processes, and helping teams spend more time on meaningful work.
If you’re still calculating productivity manually, automation can make the process faster and more consistent.
With DeskTrack, you can track work time, activity, application usage, idle periods, and productivity trends in one place giving managers the data they need to make better workforce decisions.
Frequently Asked Questions (FAQ)
Ans. The basic employee productivity formula is: Employee Productivity = Total Output ÷ Total Input When time is the input: Employee Productivity = Total Output ÷ Hours Worked The output should be relevant to the employee’s role. Ans. To calculate productivity, define a measurable output, determine the input used to produce it, and divide output by input. For example, if an employee completes 200 tasks in 50 hours: 200 ÷ 50 = 4 tasks per hour Ans. Useful employee productivity metrics include output per hour, task completion rate, revenue per employee, utilization, productive time, quality rate, and project completion metrics. The best combination depends on the employee’s role and business objectives. Ans. Use a combination of outcome-based metrics, time data, task completion, project progress, quality measures, and activity trends. The goal should be to understand work patterns and outcomes rather than simply measuring whether someone is online. Ans. A staff productivity report can include hours worked, productive time, idle time, tasks completed, project time, application usage, productivity trends, and other role-specific metrics. Ans. No, Productivity generally compares output with input, while efficiency focuses on how well resources are used to achieve a desired result. An employee can be productive by completing a high volume of work, but efficiency also considers whether that work was completed with minimal unnecessary resources, time, or waste. Ans. Focus on outcomes, workload, time patterns, project progress, and trends instead of constantly monitoring individual behavior. Use productivity data to identify bottlenecks and provide support rather than treating every activity metric as a performance judgment. Ans. Yes, Productivity platforms can automate the collection of time and activity data and use it to create productivity reports and trends. This reduces manual data entry and makes it easier to review productivity consistently.calculate-employee-productivity